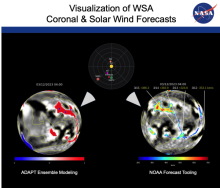
Visualization of WSA Coronal and Solar Wind Forecasts
Jaime
Landeros
California State Polytechnic University Pomona
Poster
The Wang-Sheeley-Arge (WSA) Model has stood as an essential pillar in the realm of solar wind forecasting for more than a decade, but it has lacked an intuitive, centralized, and publicly accessible method for visualizing its empirical and physics-based corona and solar wind predictions. The development of a browser-based dashboard is well suited to fill this gap. It will provide forecasters with the ability to juxtapose recent in situ and full disk satellite observations and model predictions to assess model performance, as well as to allow scientists to investigate the model’s detailed ensemble predictions from various satellite perspectives and compare them with observations. Visualized data include time series plots of solar wind speed and interplanetary magnetic field (IMF) polarity, as well as projected maps of derived coronal holes overlayed on EUV coronal hole observations, the heliospheric current sheet location at 5 solar radii, and probabilistic predictions of satellite-footpoint connectivity. Predictions are available for satellites dispersed throughout the Heliospheric System Observatory, including ACE, STEREO-A, PSP, and SolO. The project has been developed with maintainability and ease of deployment in mind with the Plotly Dash framework in Python, targeted JS functions to reduce latency, Git version control, and Docker containerization.
Poster PDF
Meeting homepage