Using rapid radiosonde launches during extreme changes in water vapor transport in atmospheric river events to optimize ground-based GPS ZTD solutions
Hong
Liang
Chinese Meteorological Agency, visiting Scripps Institution of Oceanography, UCSD
Poster
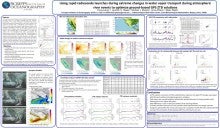
Low level water vapor transport over the California coastal mountains has been shown to be highly correlated with the maximum precipitation in the coastal mountains in wintertime Pacific storms, where the dynamics are dominated by a low level jet ahead of the cold front associated with a mid-latitude cyclone (Neiman et al., 2013). In these cases with relatively simple dynamics driven by the orographic precipitation mechanism, water vapor transport can be quantified as the integrated water vapor multiplied by the mean wind speed in the controlling layer at approximately 1 km above the surface. Here we investigate how closely ground-based GPS measurements can track the rapid acceleration and deceleration of onshore moisture flow by comparing them to a unique dataset of rapidly launched radiosondes in several atmospheric river events in January and February 2017 carried out by the Center for Western Weather and Water Extremes (CW3E). An increase in ZTD corresponding to 16 mm of Precipitable water (PW) over 21 hours on February 7 was measured the day the damage to the spillway at Oroville Dam in northern California was detected (https://ww2.kqed.org/news/2017/02/07/engineers-assess- spillway-problem-at-oroville-dam/#feb07). This was followed by a decrease of 16 mm PW over 12 hours later that day, then an even more rapid increase of 16 mm PW over 8 hours on February 8. The GPS ZTD tracked every feature in the 3 hour radiosonde observations over this time period. Given the empirical relation derived for IVT, with 14 m/s winds in the controlling layer, this would implies an increase in rain rate of 3-4 mm/hr at this critical time.
Because capturing the time scales of variability accurately in these rapidly changing precipitation events is so important, we use this high temporal resolution dataset to perform experiments testing the GPS data analysis approach. We found in these experiments that the ZTD constraint should be in the range 0.01 to 0.02 m/sqrt(hr). Looser constraints introduced spurious variations not confirmed by the radiosondes observations. A value of 0.05 m/sqrt(hr) was found to underpredict the true variability measured by the radiosondes. We also investigated the ability to reproduce these rapid changes in ZTD varying the mapping function, solution interval and inclusion of gradients, to determine the optimal parameters for this type of case. With these optimal constraints, the GPS ZTD observations were shown to track the radiosondes with correlation coefficients larger than 0.98 and standard deviations less than 10 mm delay or 2 mm equivalent PW. We conclude that the dense observations of ZTD available in California could provide valuable real-time model verification at hourly time resolution for atmospheric river events that would provide increased confidence in short term precipitation forecasting.
Because capturing the time scales of variability accurately in these rapidly changing precipitation events is so important, we use this high temporal resolution dataset to perform experiments testing the GPS data analysis approach. We found in these experiments that the ZTD constraint should be in the range 0.01 to 0.02 m/sqrt(hr). Looser constraints introduced spurious variations not confirmed by the radiosondes observations. A value of 0.05 m/sqrt(hr) was found to underpredict the true variability measured by the radiosondes. We also investigated the ability to reproduce these rapid changes in ZTD varying the mapping function, solution interval and inclusion of gradients, to determine the optimal parameters for this type of case. With these optimal constraints, the GPS ZTD observations were shown to track the radiosondes with correlation coefficients larger than 0.98 and standard deviations less than 10 mm delay or 2 mm equivalent PW. We conclude that the dense observations of ZTD available in California could provide valuable real-time model verification at hourly time resolution for atmospheric river events that would provide increased confidence in short term precipitation forecasting.
Poster PDF
Abstract file
Abstract file
Meeting name
Joint COSMIC Tenth Data Users' Workshop and IROWG-6 Meeting