WINGS Fellow Researches Improvements to S2S Forecasts Using the Stratospheric Polar Vortex
Subseasonal-to-seasonal forecasts (S2S), those that predict weather beyond two weeks and up to two months into the future, equip forecasters with information to keep the public informed about developing weather, especially in winter. WINGS Fellow Elena Fernández is researching approaches to improving S2S forecasts – specifically, forecasts of extreme wintertime temperatures – using machine learning methods.
Credit: Elena Fernández
Fernández is a recipient of the NOAA Weather Program Office (WPO) Innovation for Next Generation Scientists (WINGS) PhD Dissertation Fellowship that is administered by UCAR | Cooperative Programs for the Advancement of Earth System Science (CPAESS).
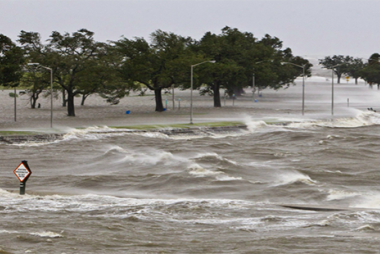
“How can we improve probabilistic outlooks of things such as temperature extremes beyond the two-week time frame? We care about this because extreme cold in winter affects people, infrastructure, and emergency preparedness,” says Fernández. “This winter in particular was especially brutal in various parts of the country.”
The stratospheric polar vortex forms during the Northern Hemisphere winter, its extreme cold over the poles forming as the Earth tilts away from the Sun. When stable, it sits above the Arctic region where winds of the polar jet stream travel counterclockwise in a circular motion, from 5 to 30 miles above the surface of the Earth. This equilibrium, however, can be disrupted by Rossby waves, long atmospheric waves that flow parallel to the equator as a result of Earth’s rotation. When disrupted, Rossby waves can push warm air from the equator northward thereby reconfiguring the polar jet stream and the polar vortex from its circular shape to a kidney-like shape. The reshaping pushes cold air southward and influences weather in the troposphere, the layer of the atmosphere closest to the Earth and where our weather occurs.
This mechanism is central to Fernández's research. “Changes to the strength and location of the stratospheric polar vortex serve as a known source of predictability into the troposphere,” notes Fernández. In addition, certain metrics like zonal wind speed and other non-zonal metrics describing the geometry of the polar vortex shape can aid in predicting temperature extremes in the Northern Hemisphere. Her work focuses on how the stratosphere, due to its known patterns, can serve as a predictor for forecasts of opportunity or a basis for improving forecasts in the troposphere.
Fernández studied peer-reviewed literature on the polar vortex that discussed using polar vortex fields to identify its outer edges as a means of documenting the evolution of its shape over time.
Building on this previous work, Fernández developed an alternative method to describe specific geometric evolutions of the stratospheric polar vortex as a daily timeseries. These “stratospheric polar vortex ellipse metrics,” she notes, were calculated using data from the ECMWF Reanalysis v5 (ERA5), a dataset containing variables such as temperature and pressure dating to 1940. She used data from 1959 to the present for winter seasons in the Northern Hemisphere. The derived stratospheric polar vortex ellipse metrics were subsequently used as predictors in the development of a machine learning model framework.
Her goal was to determine whether these past measurements of the stratospheric polar vortex could be used to improve predictions of future tropospheric temperature responses in S2S forecasts. “The challenging part with machine learning is that you need a lot of data but we lack well-resolved data in the stratosphere,” Fernández said.
She developed two machine learning models that would allow for comparison on their forecasts of near-surface temperatures. The first, more complex in structure and the second, simpler.
The first method was a Long Short-Term Memory model, a type of recurrent neural network that is developed for time-series data, like that from the ERA5. The program used memory cells that retain information from preceding instructions over periods of time in order to determine future actions.
“This approach was great in concept for a subseasonal model where you want to be able to look at a long window and then use that information to forecast out 14-plus days,” said Fernández. “In this way you could get a better understanding of how the vortex evolves over that time and how that can be used to translate into a forecast.”
The simpler model was based on a random forecast model that used "singular input-to-output communication” she noted. Was complexity better than simplicity?
The resulting forecasts from the two models were similar. “The time-series information really didn’t make much of a difference in producing the actual outlook,” Fernández said. “The rule of thumb with machine learning is that when a simpler model works, you use that one because it is more cost-efficient.”
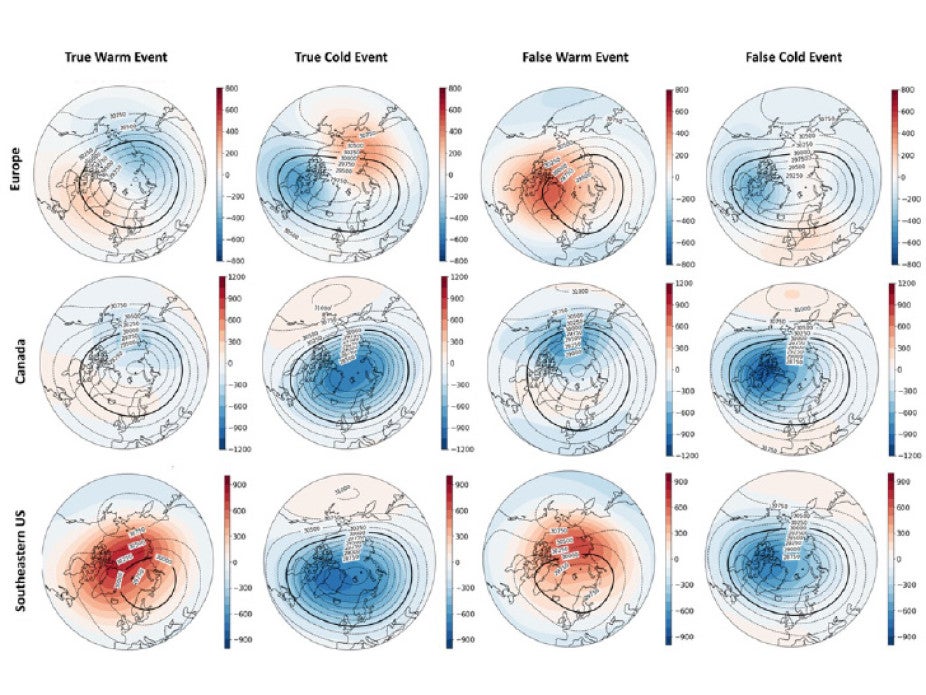
Composites of the 10-hPa GPH (contours) and the corresponding anomalies (shading) for the testing input-data dates of the forecasts included in the high-confidence group (> 90th percentile of confidence) from the Ellipse Random Forest Model. The composites are separated by whether the forecast was (a) correctly predicted positive, (b) correctly predicted negative, (c) incorrectly predicted positive, and (d) incorrectly predicted negative temperature anomaly forecasts. Each category is shown for the three forecasted temperature regions. The 30-km contour of geopotential height, which is a climatologically representative contour of the maximum for zonal-mean wind at the 10-hPa level, is represented by the dark black line. This contour was used for deriving the ellipse metrics utilized as input for this machine learning model.
Credit: Elena Fernández
She began using her machine learning model framework to make probabilistic temperature outlooks for different areas in the Northern Hemisphere at different lead times. Specifically, Fernández began exploring potential forecasts or windows of opportunity provided by configurations in the daily evolution of the polar vortex. “I am interested in identifying the stratospheric patterns that contribute to instances where the models are highly confident and correct in their probabilistic predictions of temperatures,” she said.
In addition to Northern Europe, Fernández ran forecasts for two other locations in the Northern Hemisphere for the same time period and using the same stratospheric inputs: the Hudson Bay region of Canada and the Southeastern U.S. What she found is that while different areas can have diverging model accuracies, they maintain similar patterns – or forecasts of opportunity – for the same signs of temperature predictions.
For example, when Canada and Europe are expected to have temperatures that are warmer than average, both regions are “picking up on the same kind of subtle atmospheric features within the stratosphere,” Fernández said. “Whereas the Southeastern U.S. picks up on changes that are more anomalous, or sudden, like sudden stratospheric warming or strong vortex events.”
While the three different forecast areas have these sources of predictability, their signals degrade as lead times increase. “So as you go further out in time and the subseasonal forecast gets longer, the clarity of those patterns degrades,” said Fernández.
Ultimately, she notes, “if we are able to see a known pattern in the state of the stratospheric polar vortex that corresponds to higher confidence of a cold or warm temperature outcome in two weeks, then we can use the information to inform decision making.”
Fernández also analyzed how well the polar vortex is represented in forecasts of the Unified Forecast System (UFS), NOAA’s collaborative Earth modeling initiative that aims to streamline the nation’s operational forecast systems. While her research goals did not involve developing tools for the UFS, in an additional step in her research, Fernándezused several UFS forecasts as testing data for her machine learning models to determine how closely they match when run alongside each other. She observed that UFS models do relatively well at representing the evolution and state of the stratospheric polar vortex, information that will be useful to researchers at NOAA.
Fernández will defend her dissertation in Spring 2026 at the University at Albany - State University of New York and is writing three manuscripts based on her research, one of which has been submitted to the Journal of Applied Meteorology and is under revision.